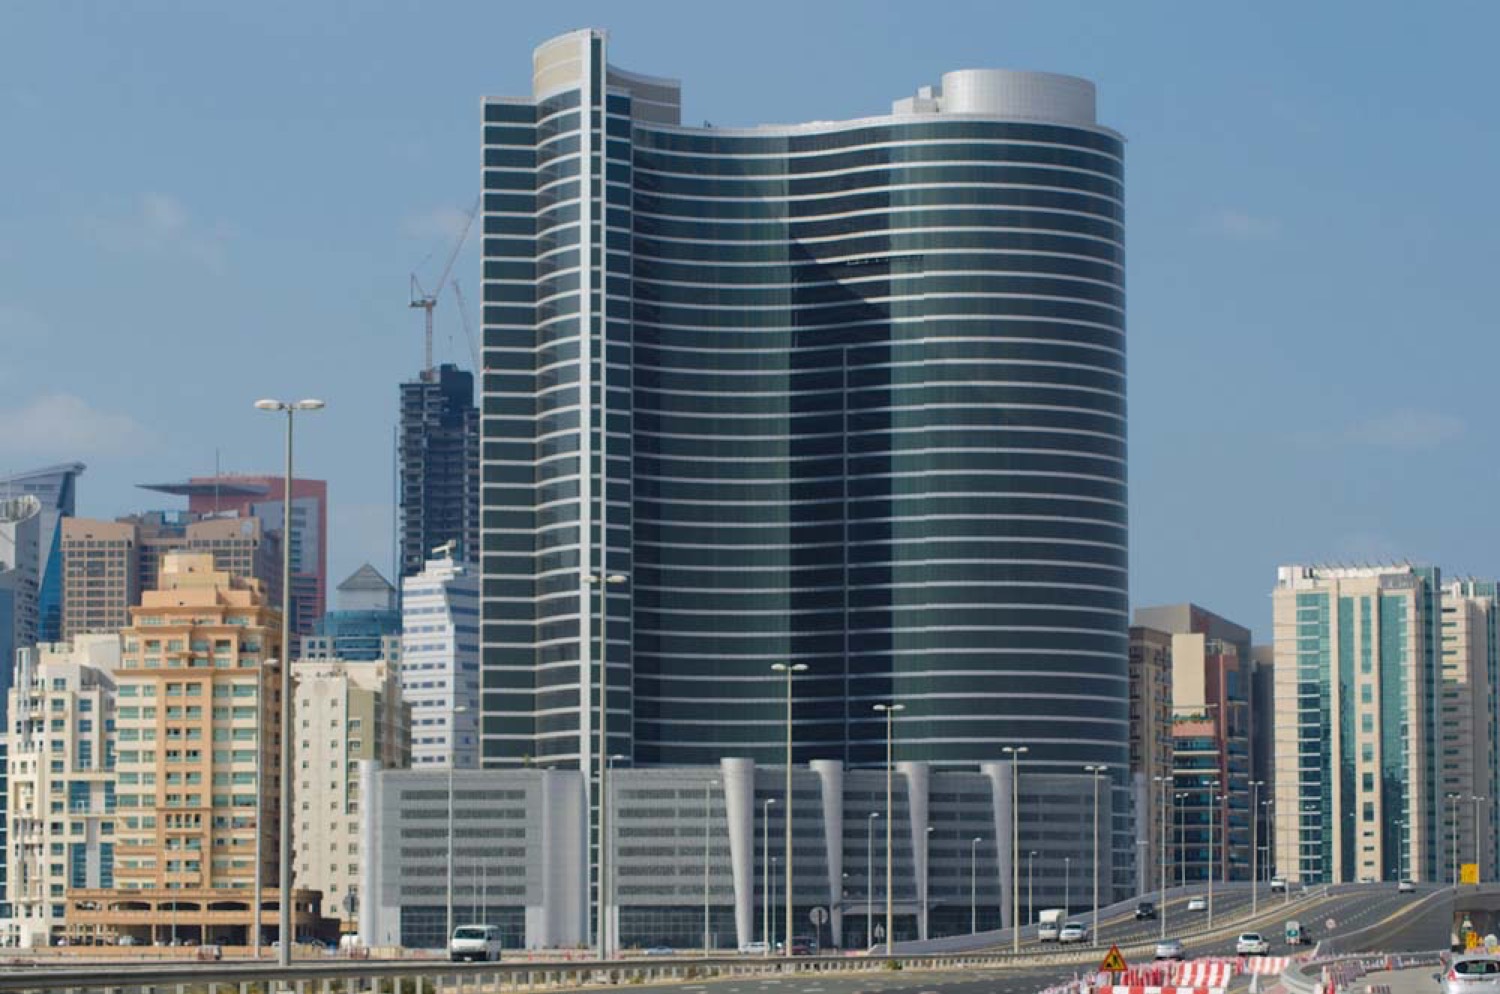
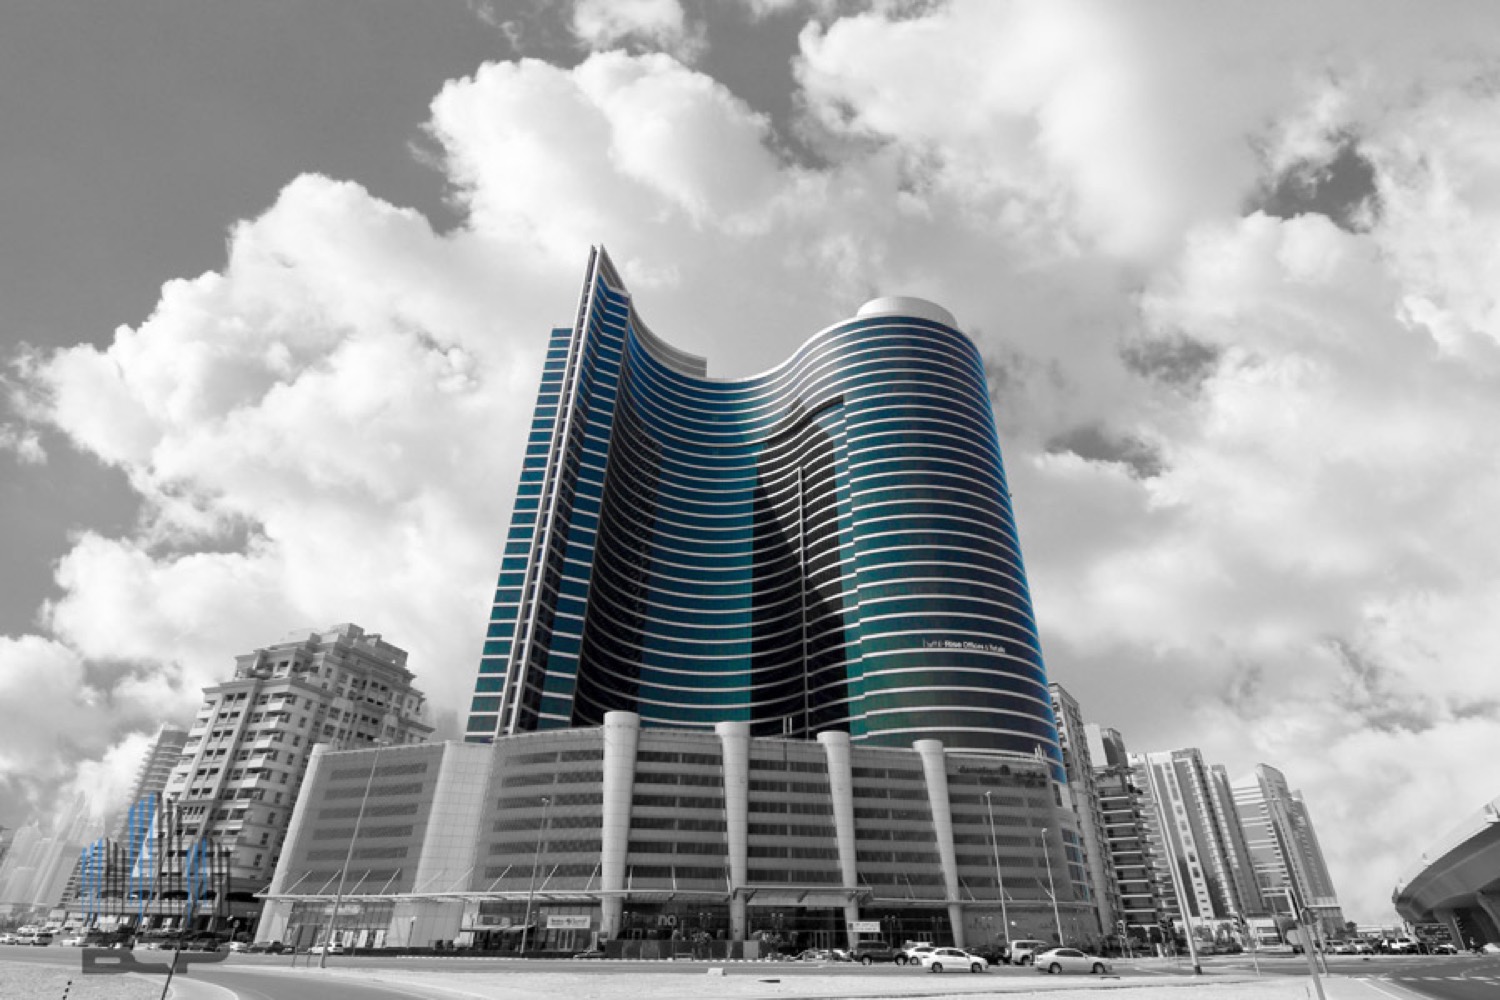
I-Rise Tower — Full Floor
Buy wholesale, manufacture the scarce product
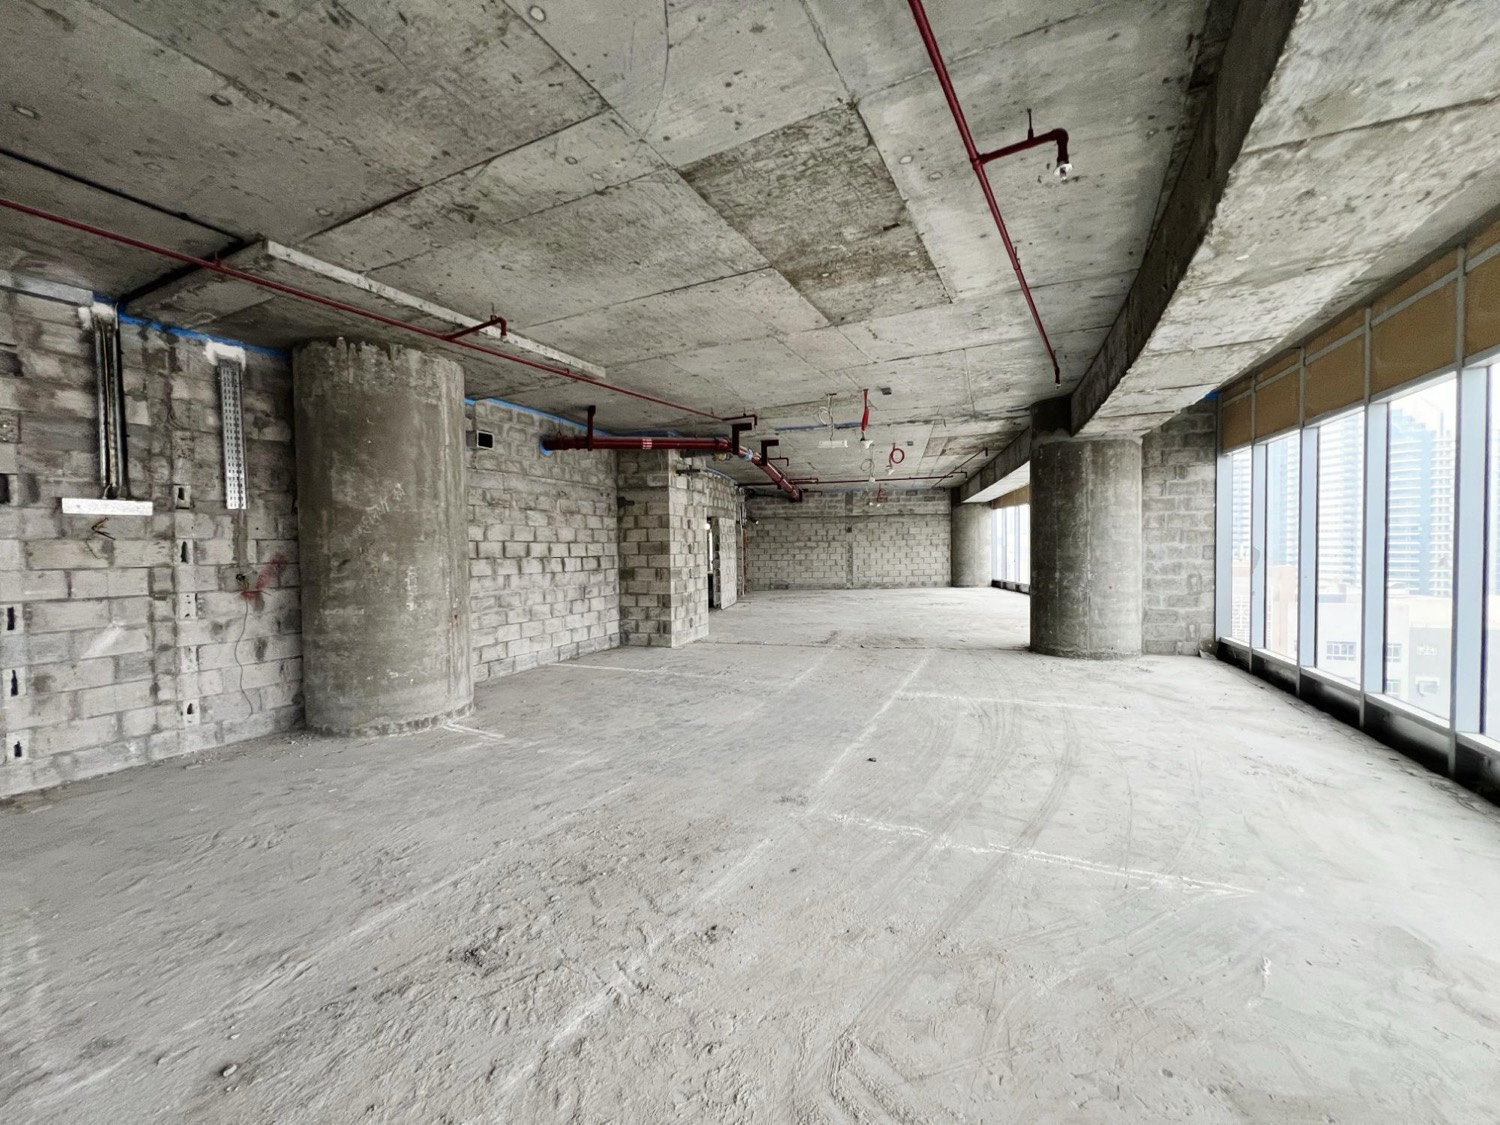
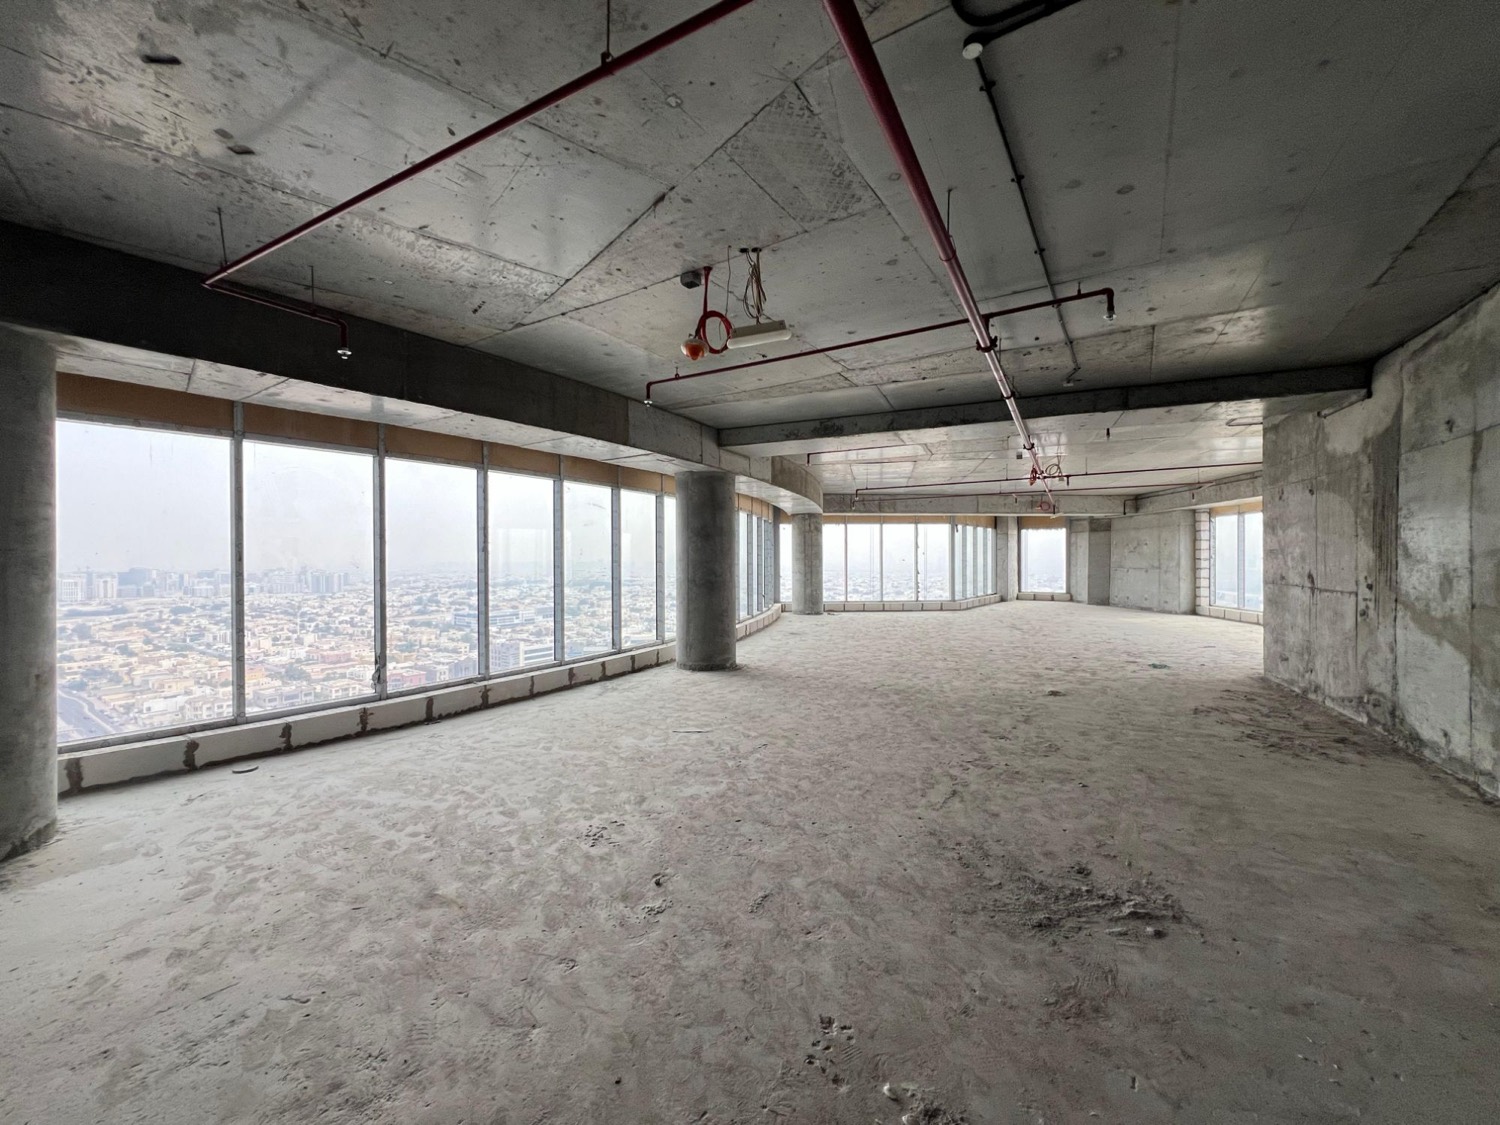
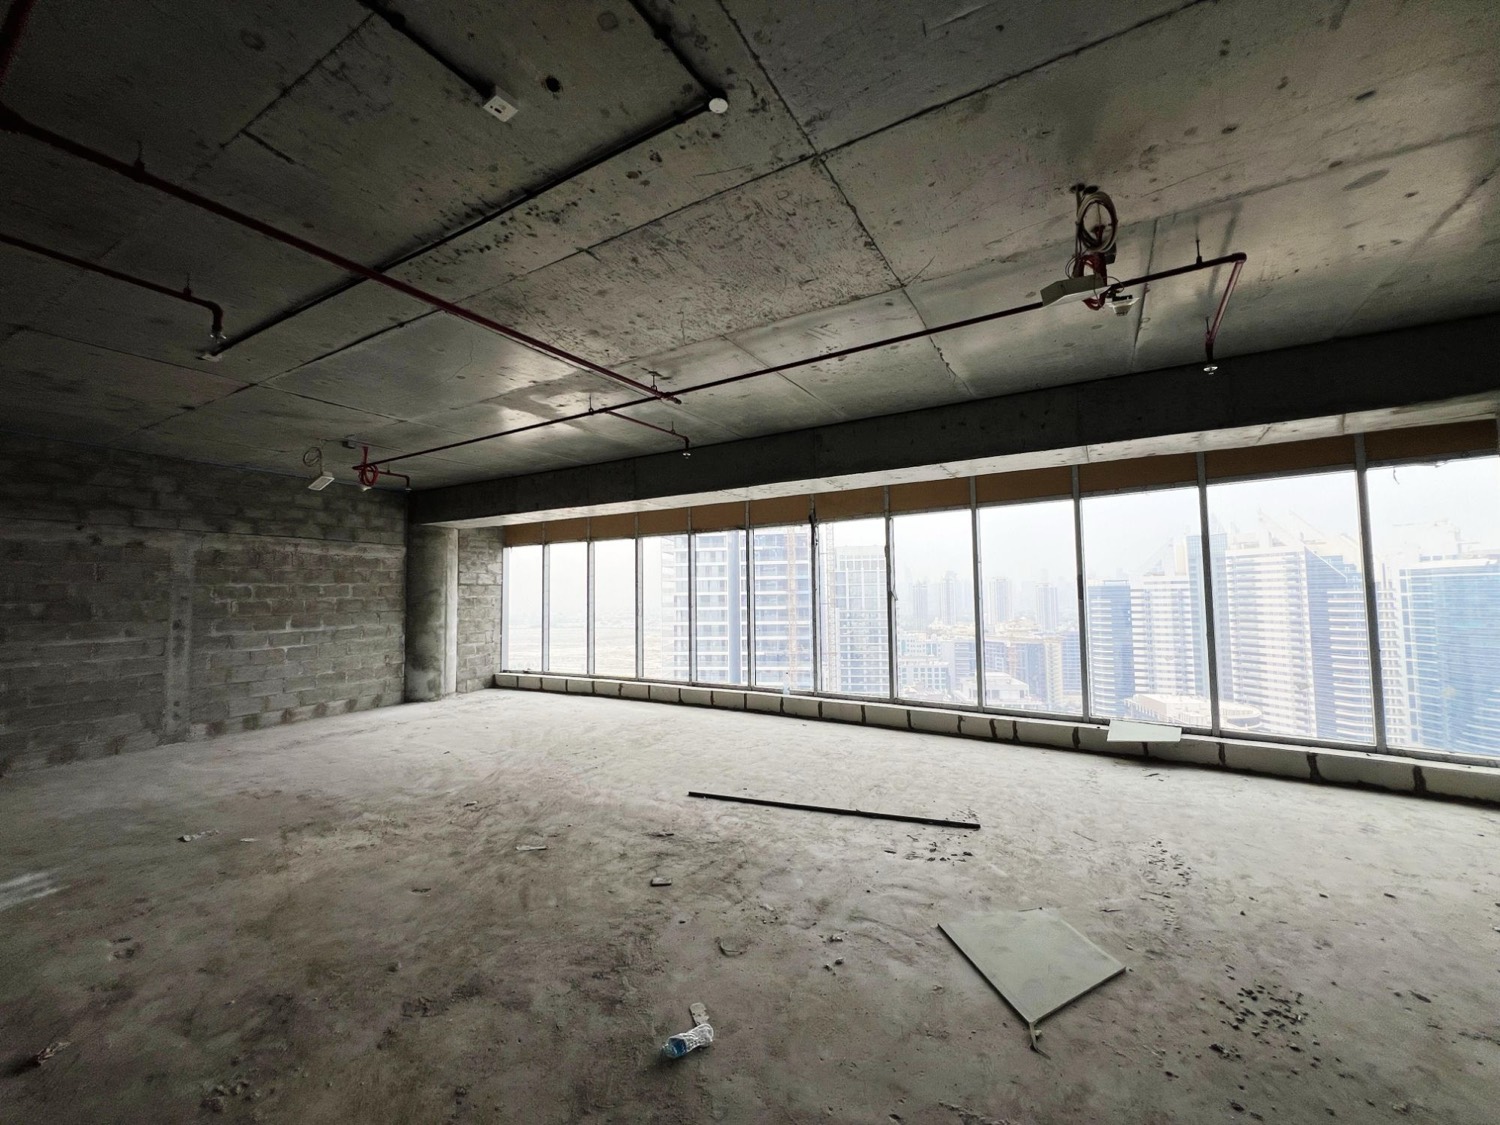
An entire 24th floor bought shell & core across 18 title deeds at ~2,700/sq ft — below actual DLD transactions in the tower and 16–27% below fitted-unit asking. The raw title mix is skewed to the small commodity band that rents at 248–294/sq ft; the value-add is combining adjacent small titles into scarce fitted 200–300 m² offices — the corporate-HQ product an undersupplied segment demands, which rents at 375/sq ft and resells at ~4,031/sq ft.
Shell & core today Before
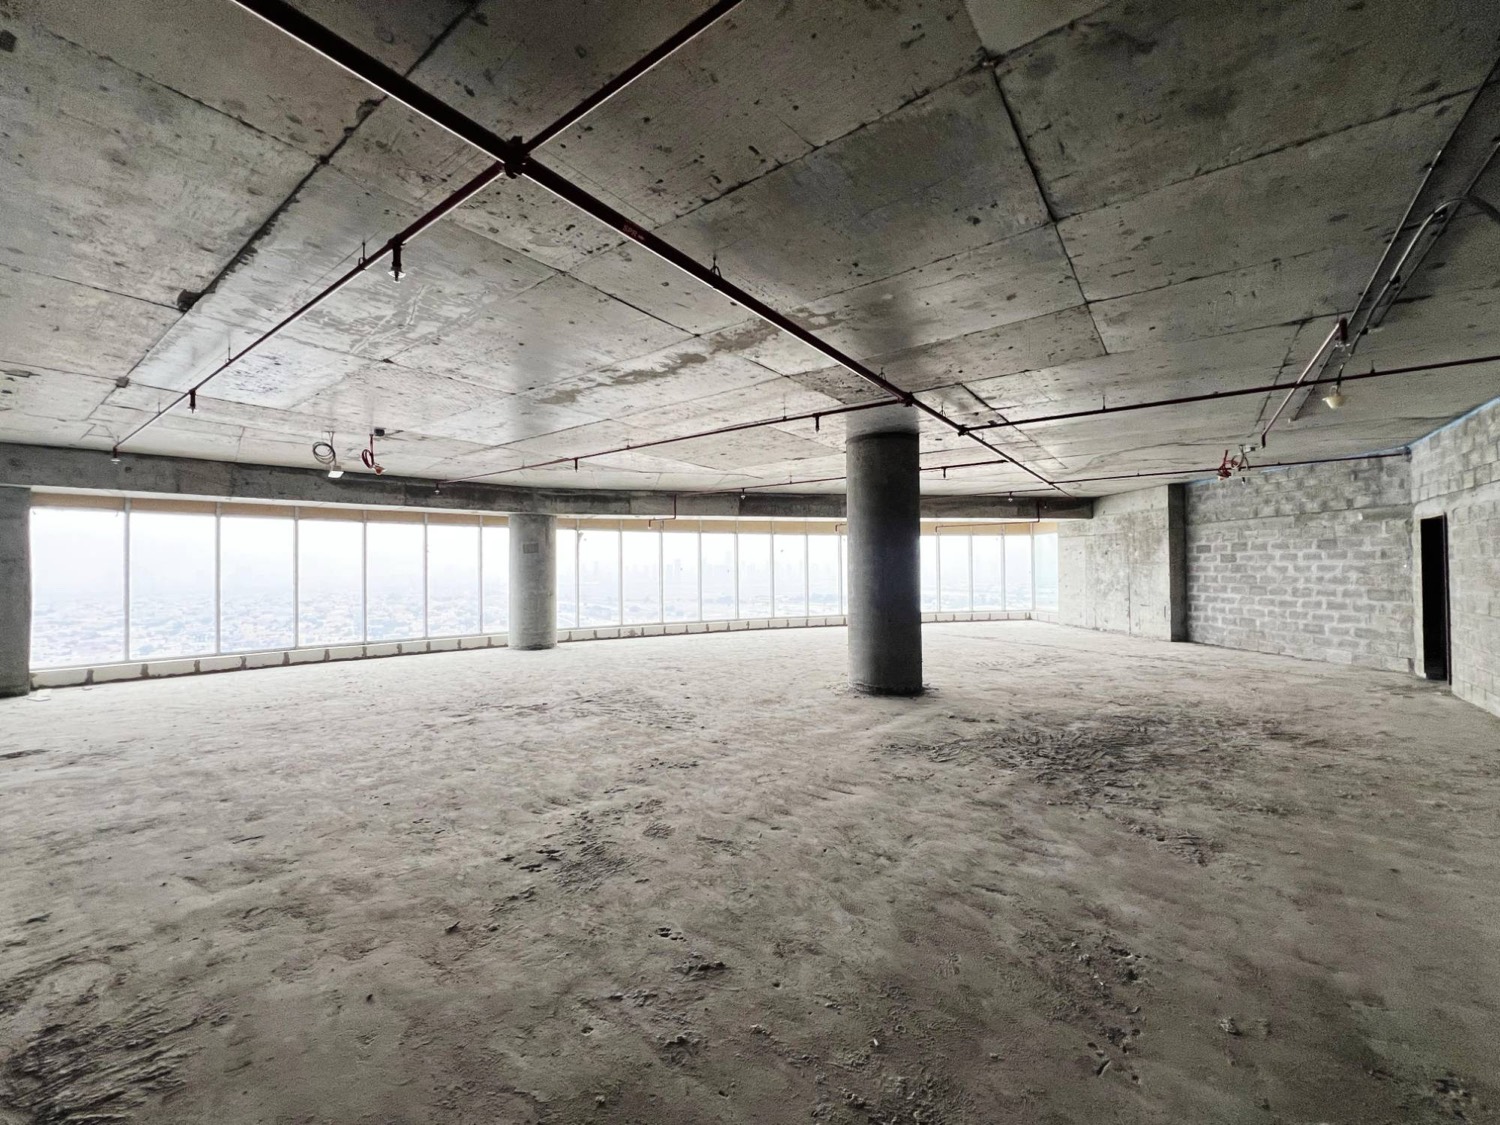
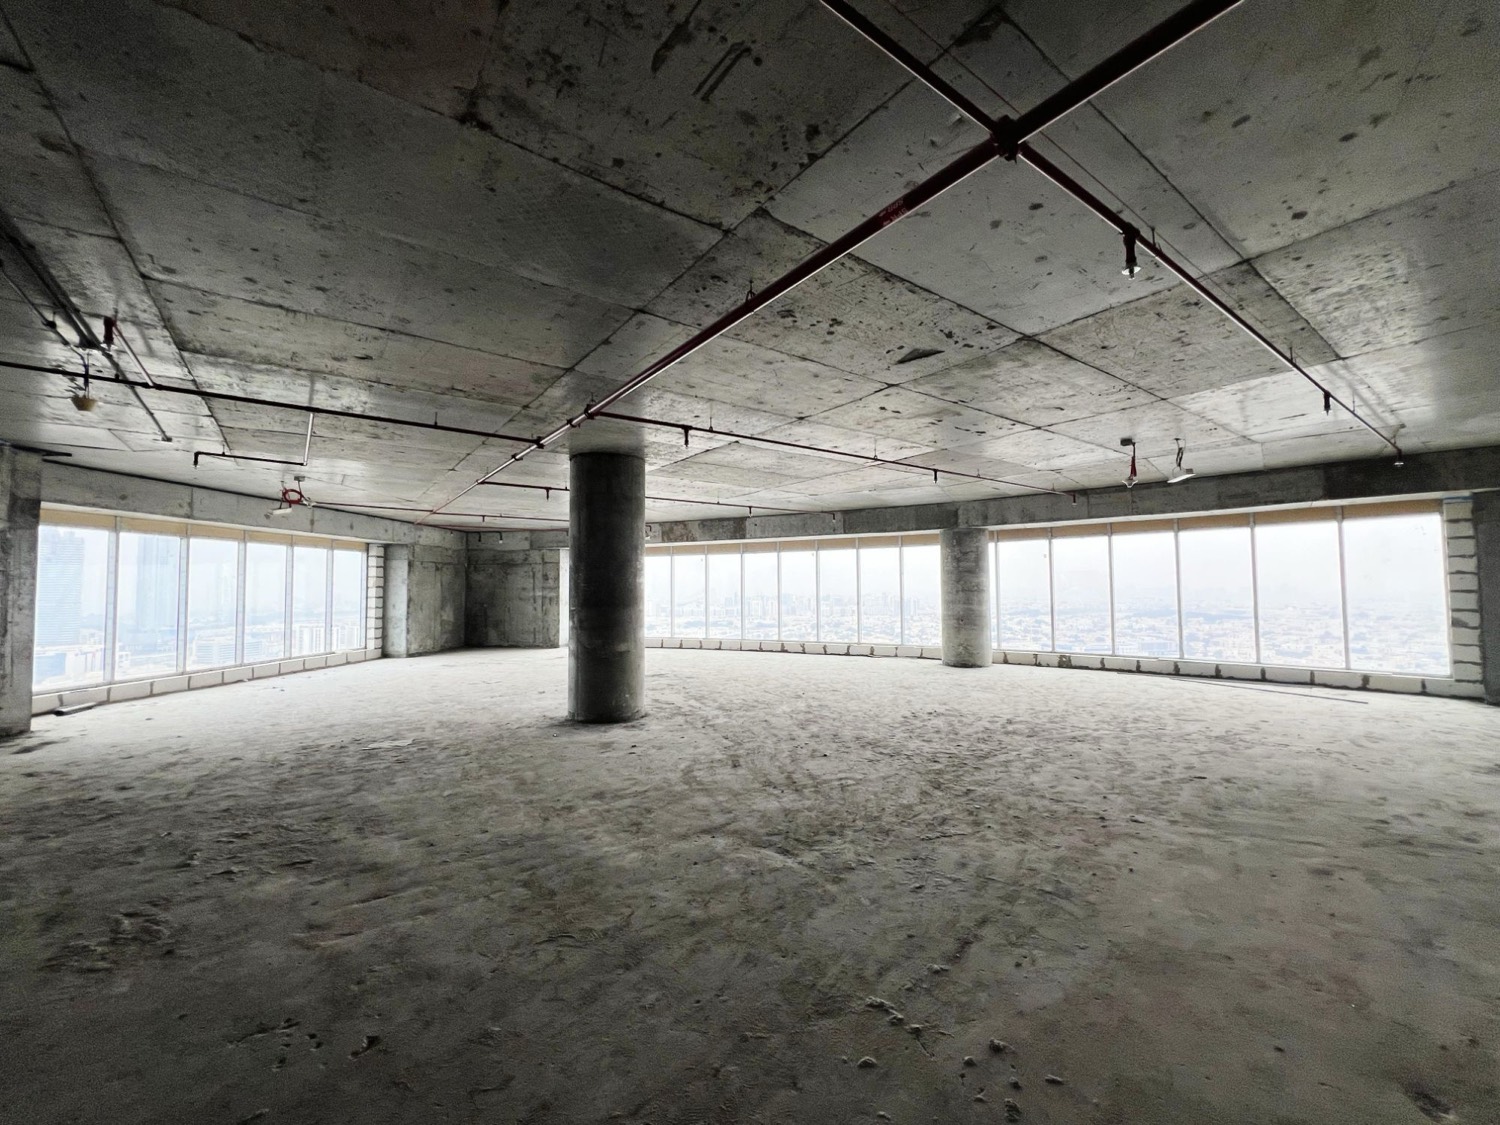
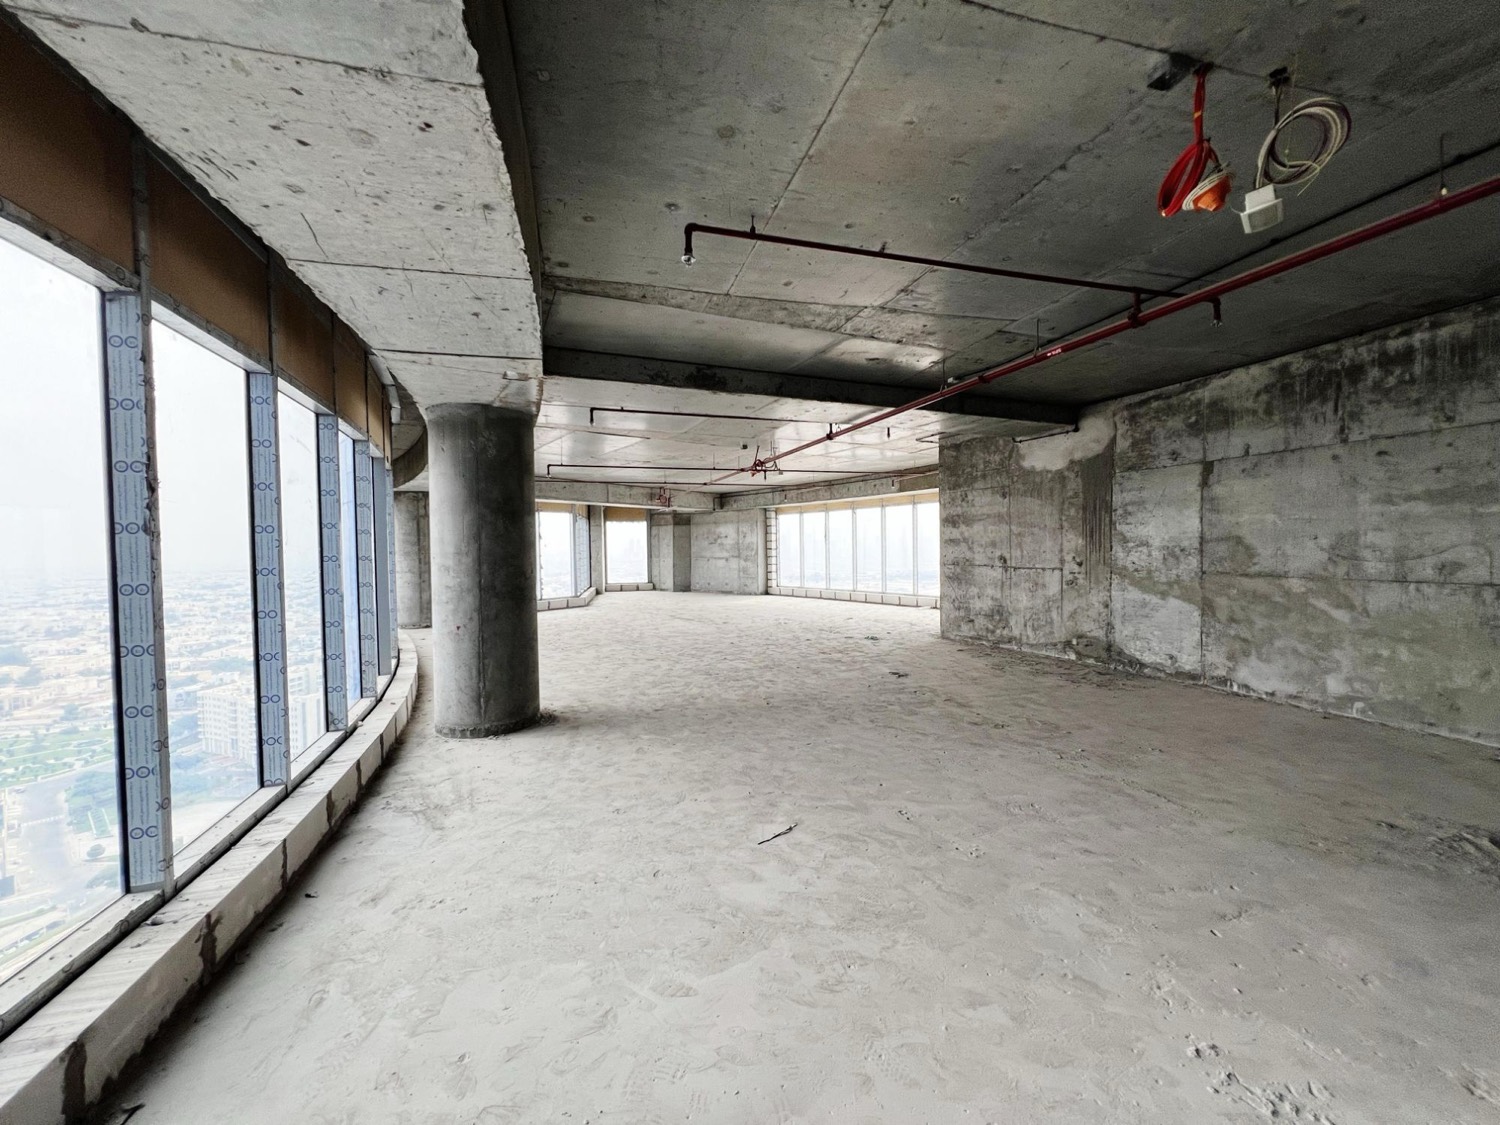
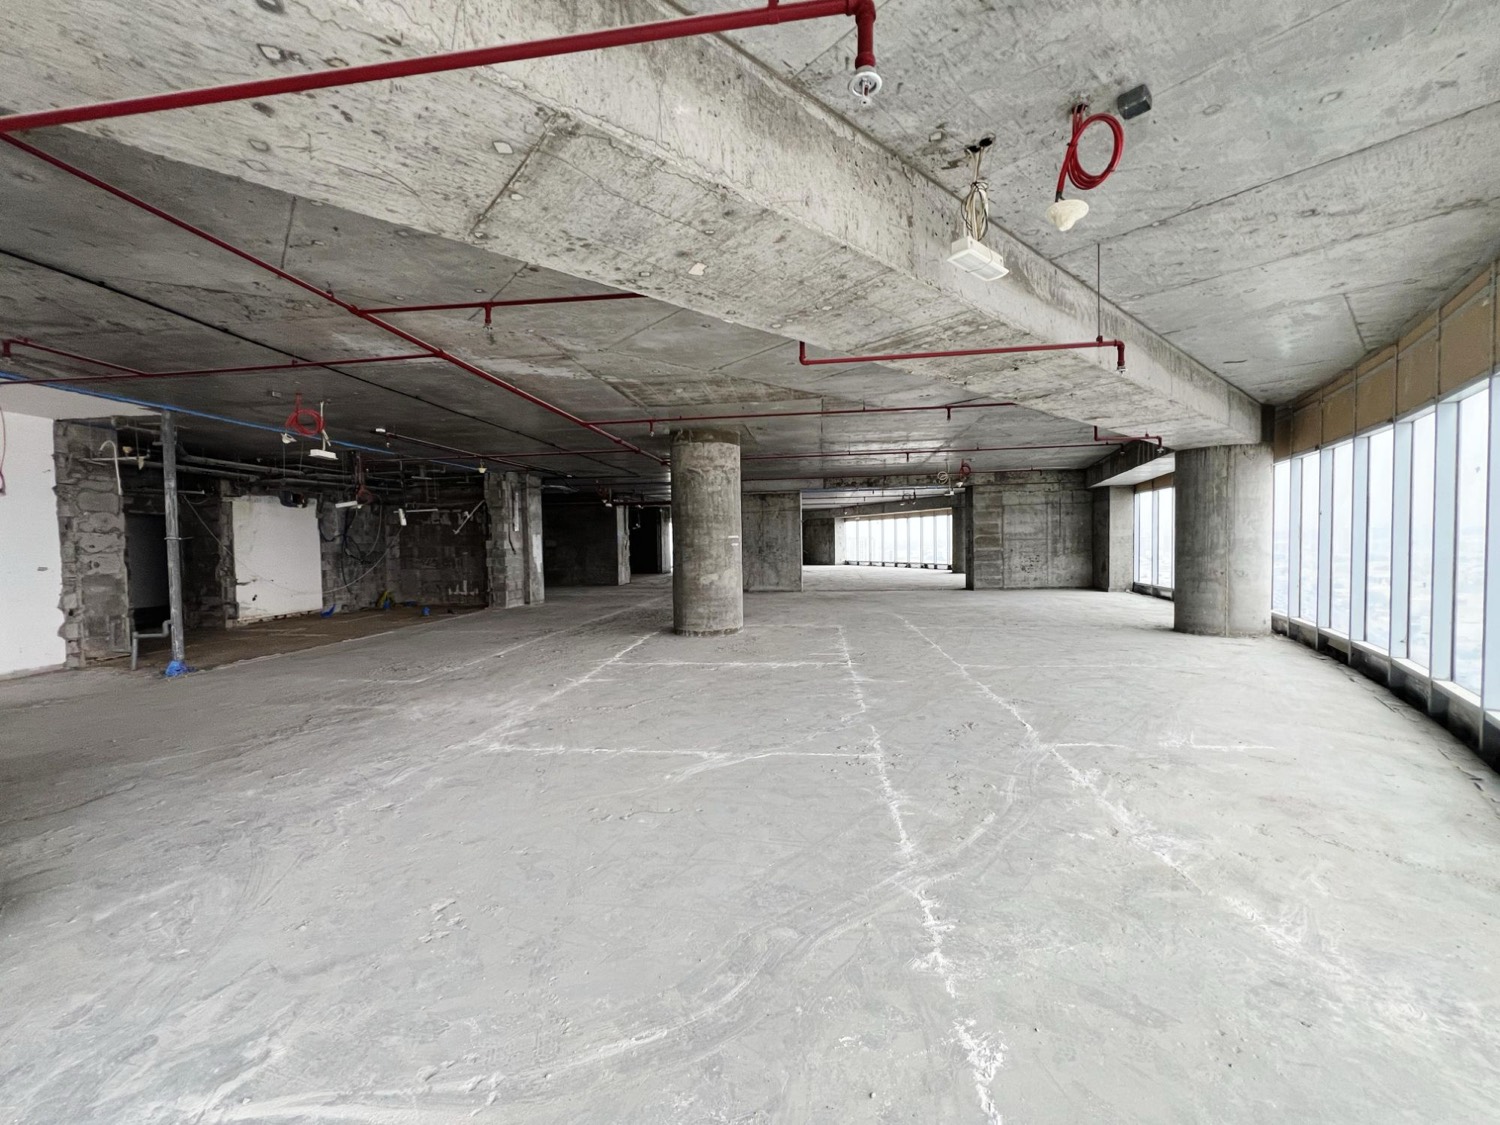
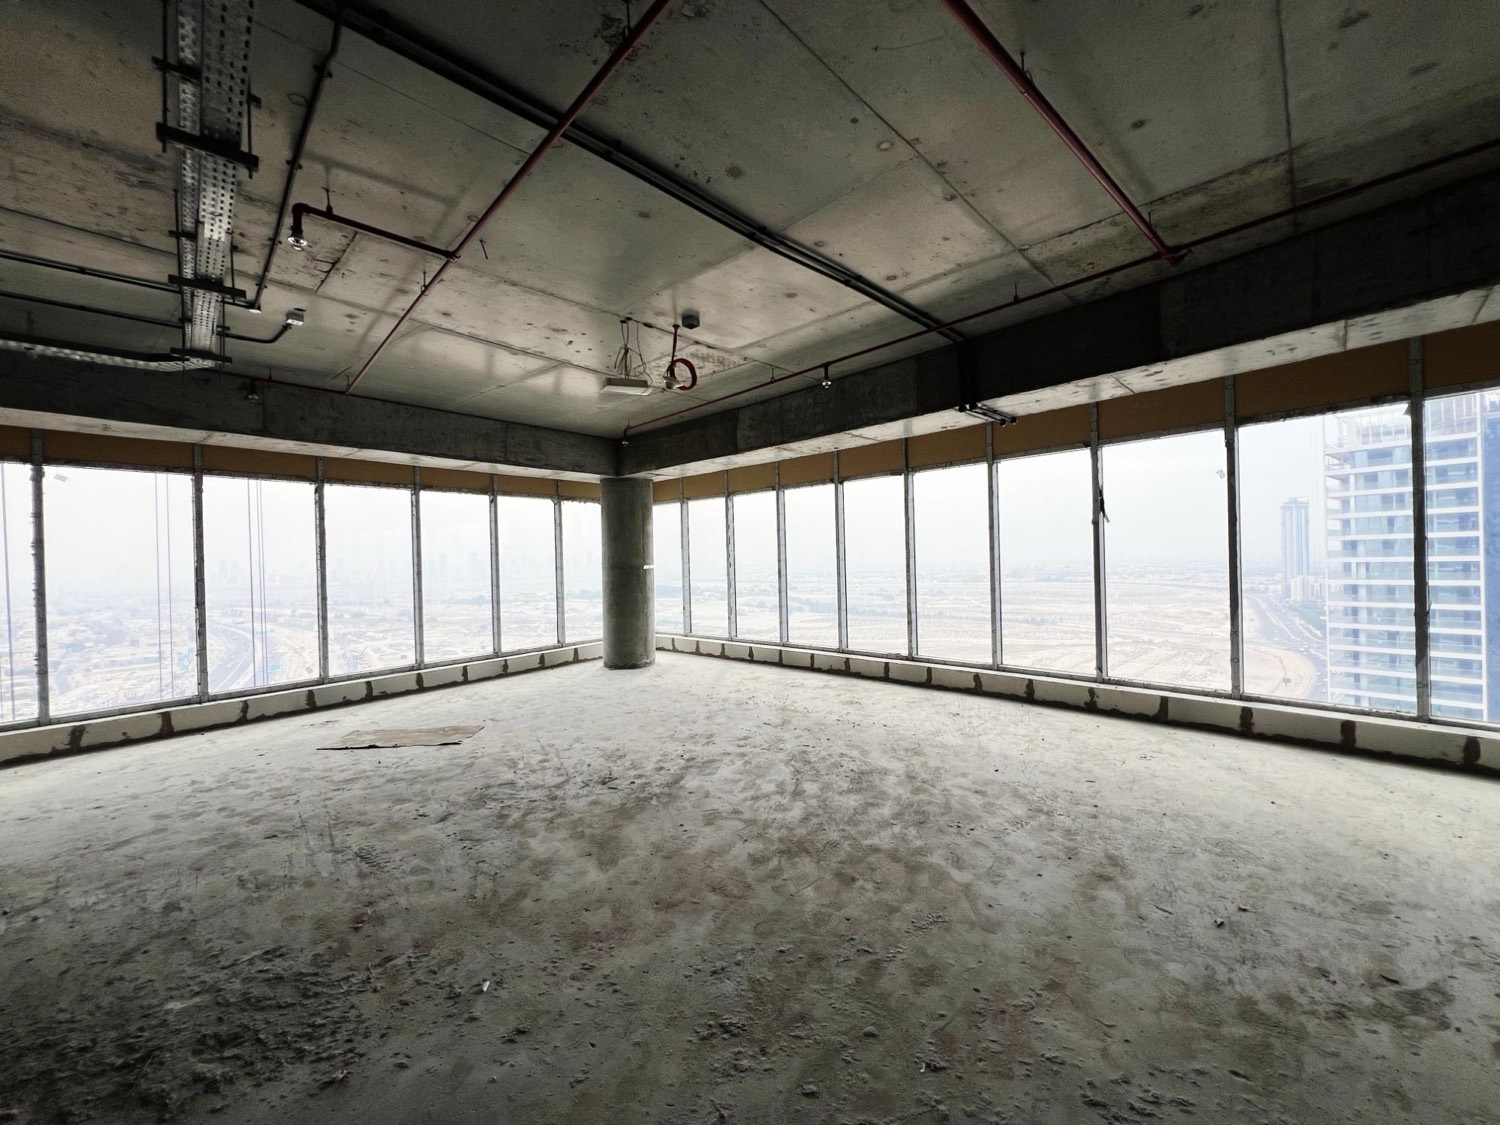
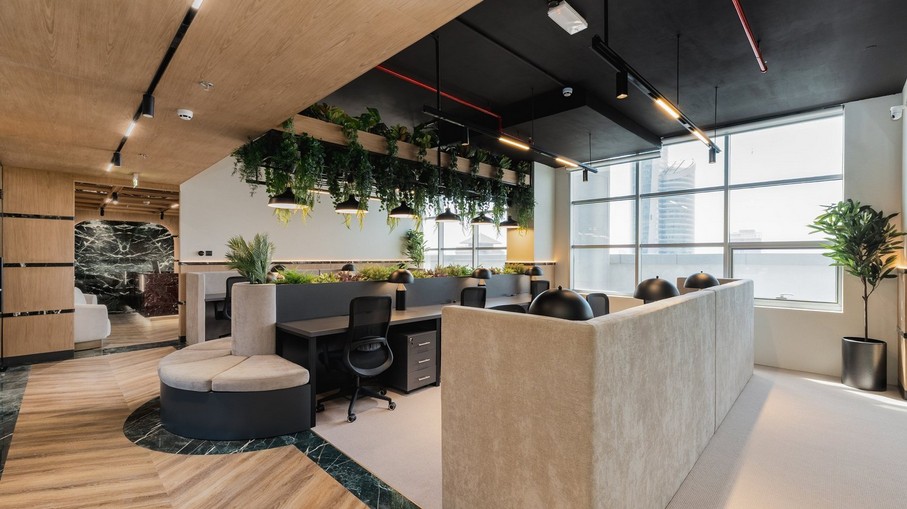
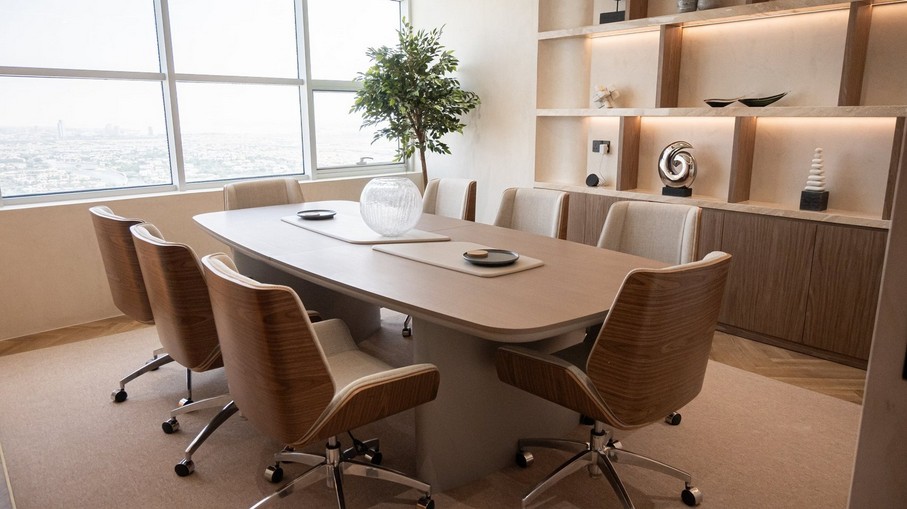
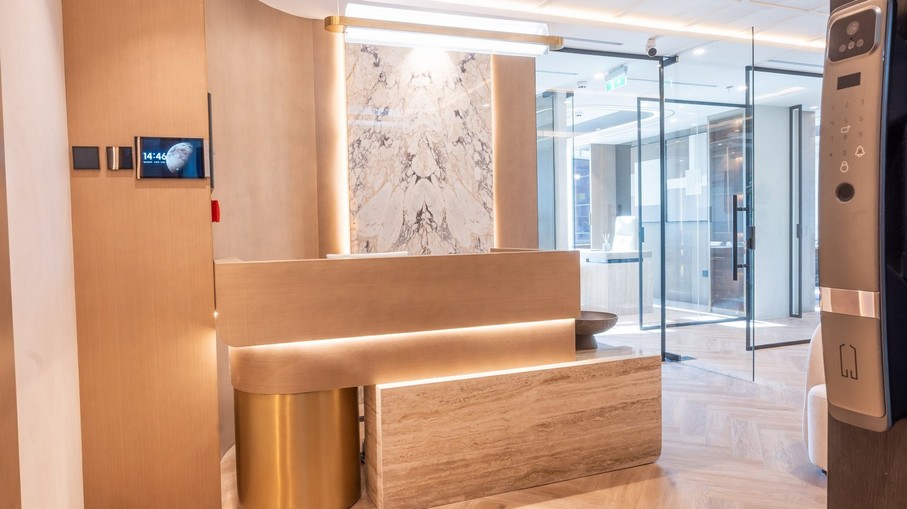
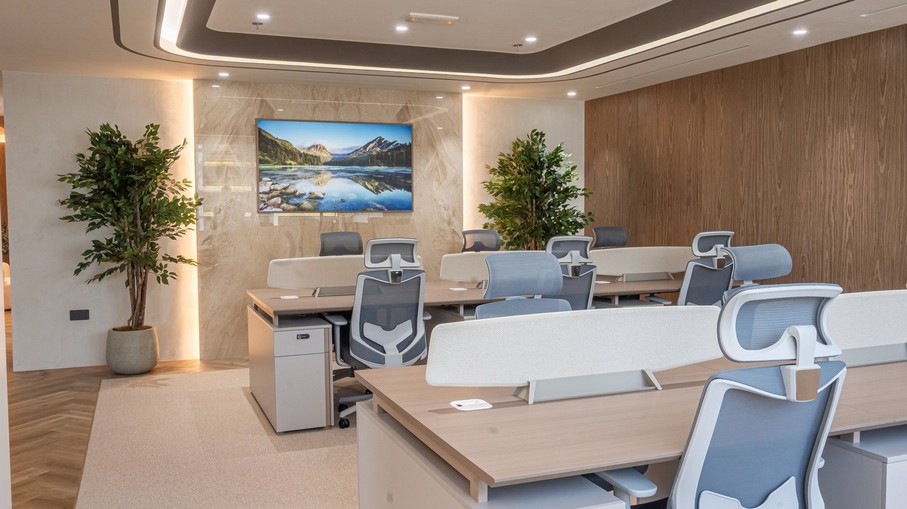
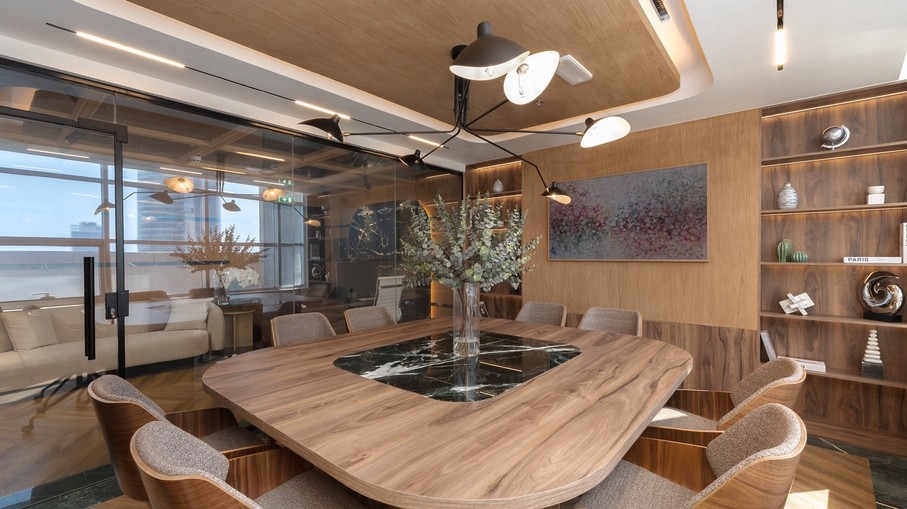
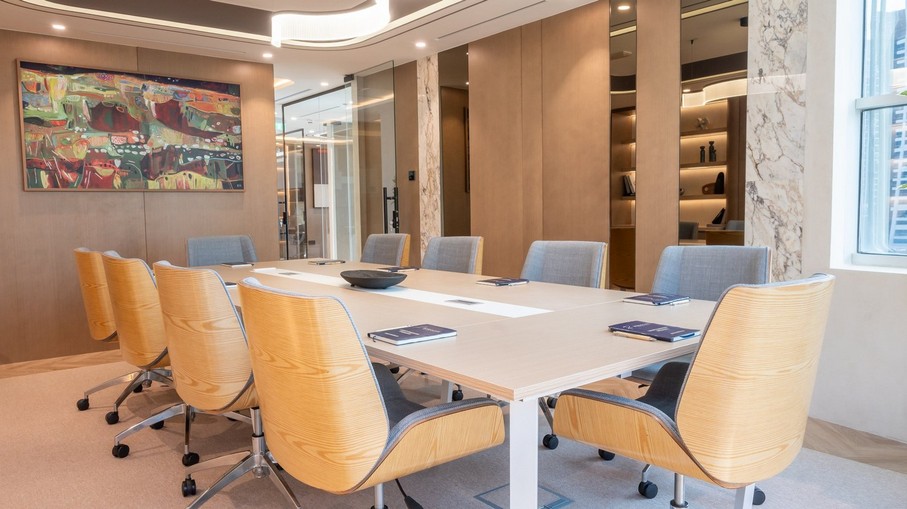
The finished product After
Fitted, income-ready executive offices — reference projects delivered by the fit-out contractor (Renolux), the quality and character the reposition targets.
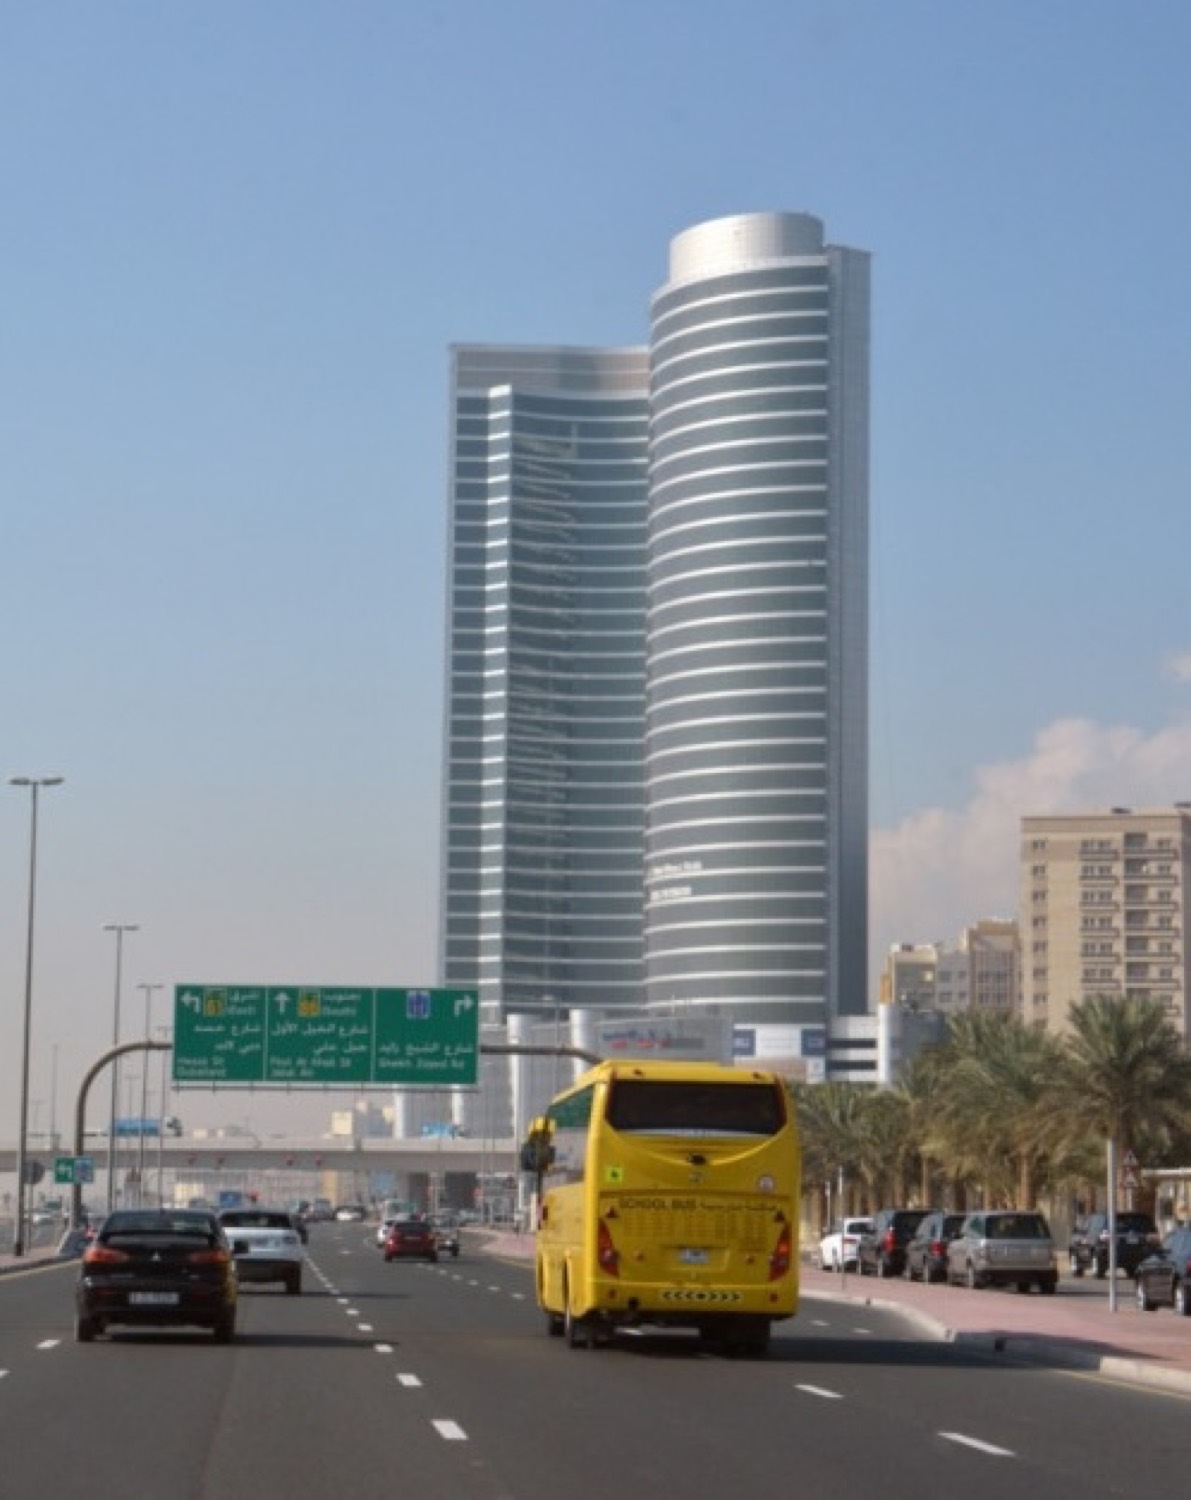
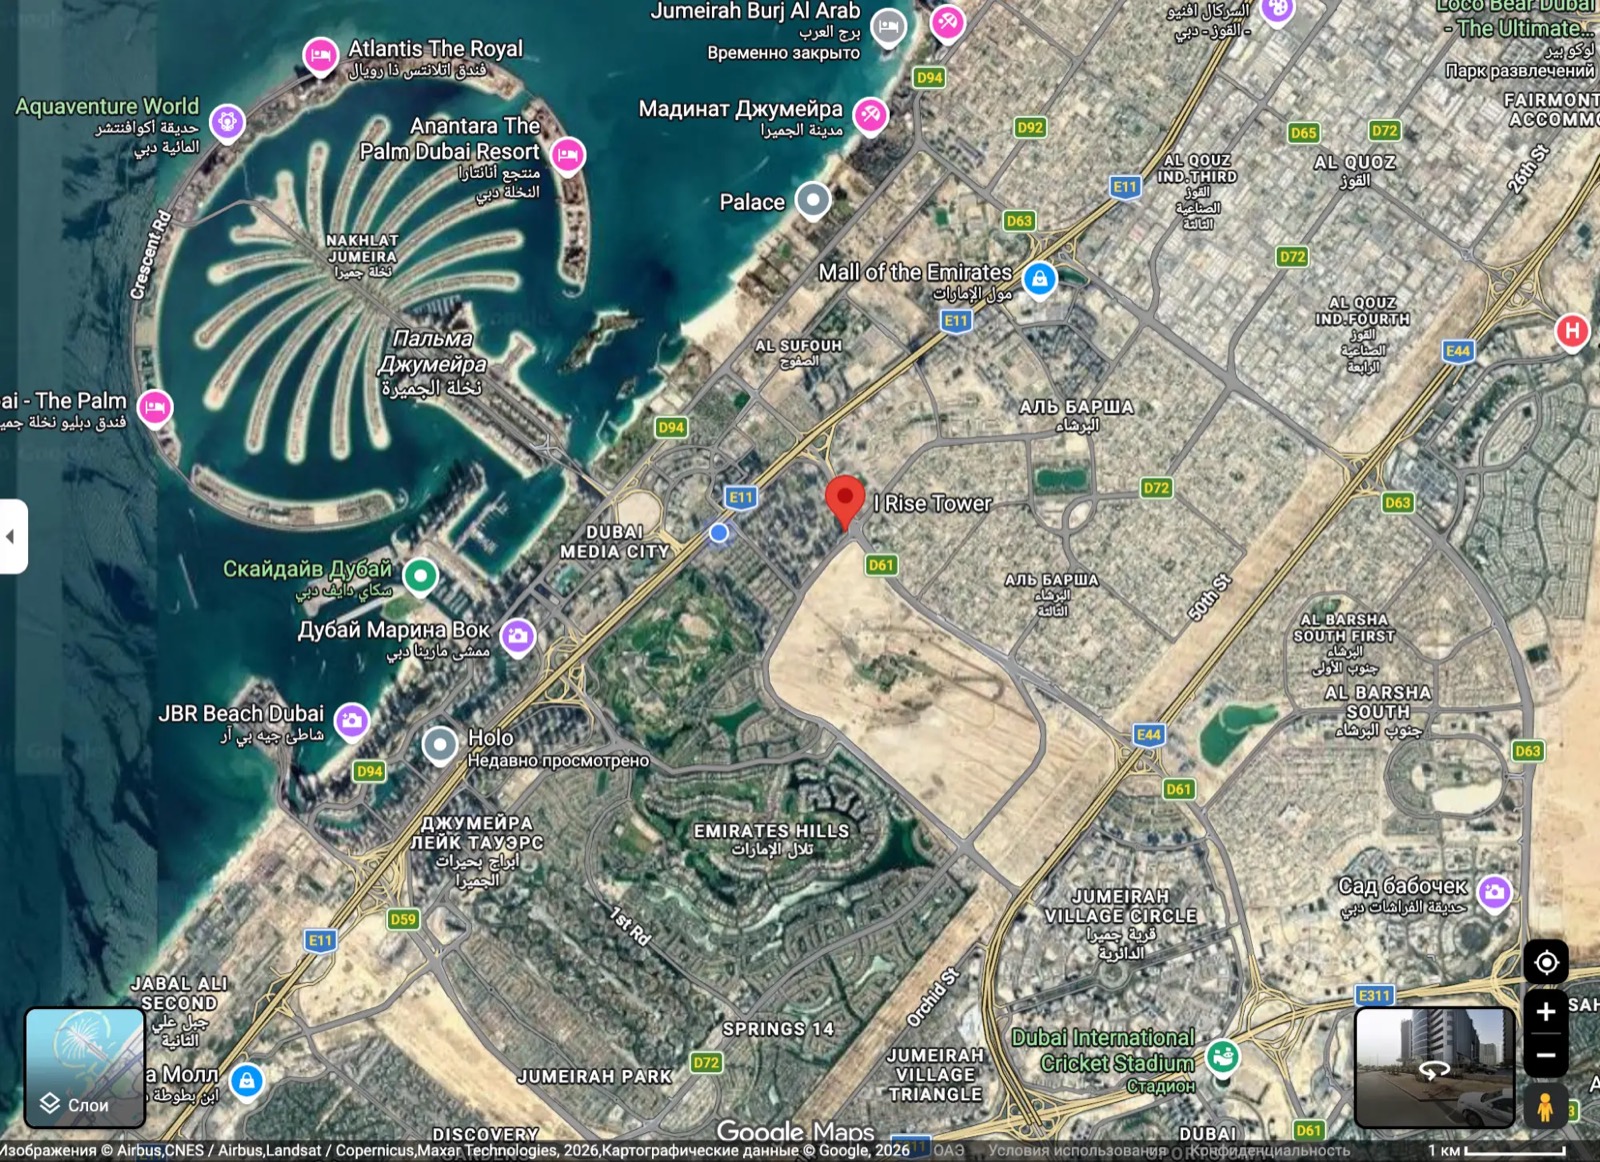
Between Dubai's business hubs
Priced below what it repositions to
| Basis | Value | Logic |
|---|---|---|
| As-is comparable (shell & core) | ~66.4M | DLD in-tower, median ~2,767/sq ft |
| Reposition GDV · fitted comps | ~95.6M | subdivided fitted 200–300 m² at market PSF |
| Exit GDV · income (NOI ÷ 8.5% cap) | ~97.1M | forward NOI 8.26M ÷ 8.5% commercial cap |
| Exit value · 4,094/sq ft | ~97.1M | net invested 77.61M ≈ −20% below |
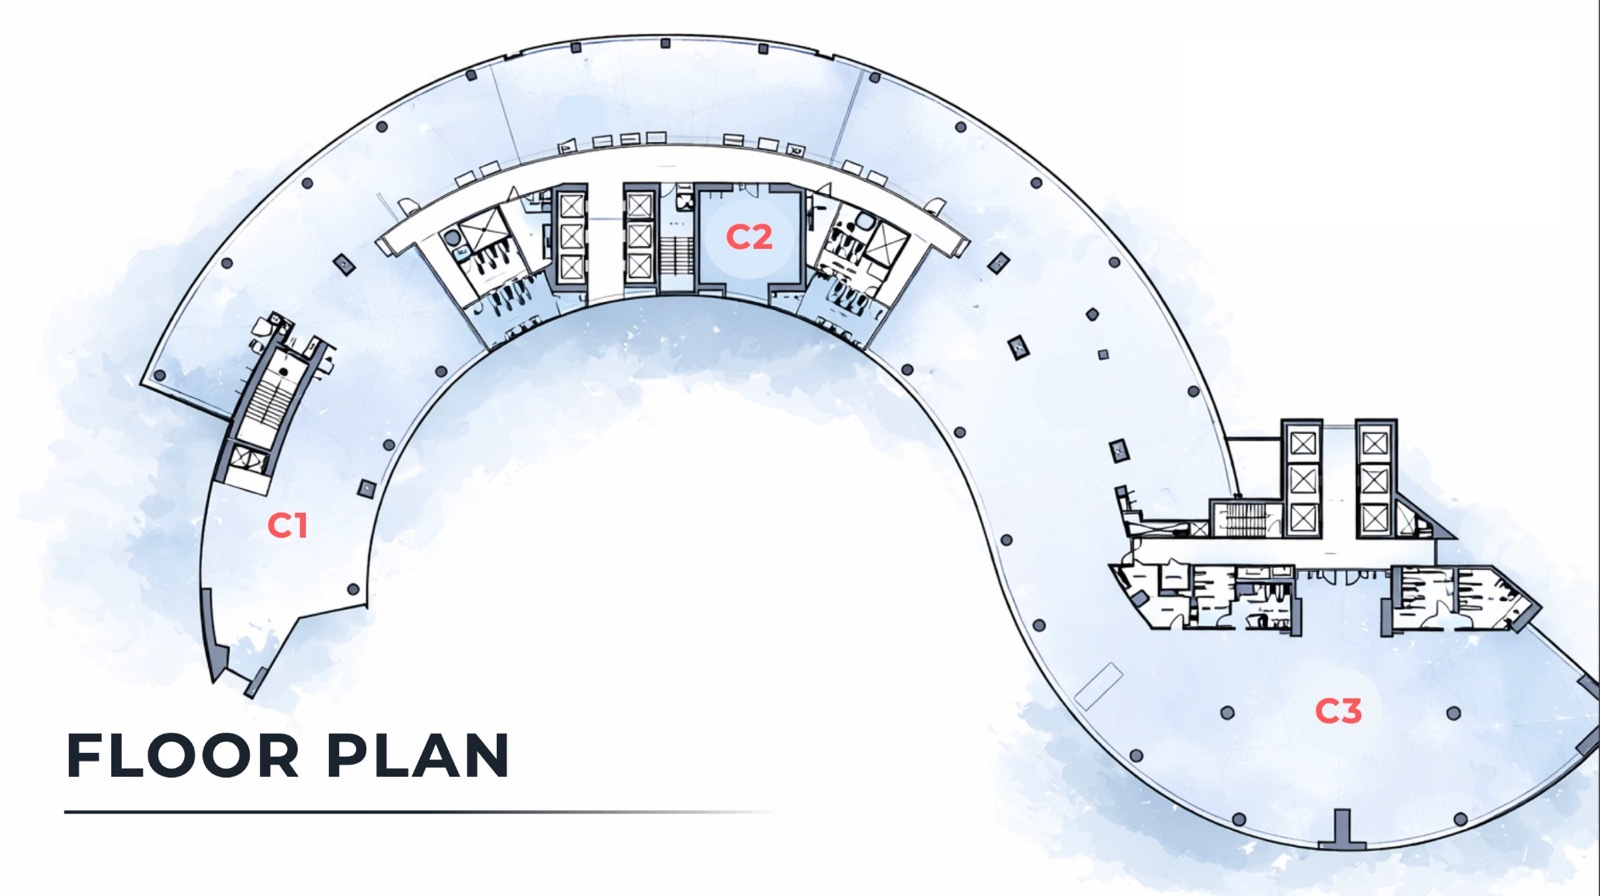
18 titles → 8 premium offices
Keep the three already-large titles as-is (228 / 324 / 321 m²); combine the fifteen small commodity titles into five 244–309 m² blocks. Per-office cash flow, conservative cycle (rent 12 mo, sale 24 mo):
| Office | Titles | sq ft | All-in | Reno | Rent/yr | Resale | ROI | IRR |
|---|---|---|---|---|---|---|---|---|
| 1 | C-01+02+03 | 2,631 | 8.85M | 0.95M | 987k | 10.61M | 17% | 13.2% |
| 2 | C-04+05+06 | 2,909 | 9.78M | 1.05M | 1,091k | 11.73M | 17% | 13.2% |
| 3 | C-07+08+09 | 2,649 | 8.91M | 0.95M | 993k | 10.68M | 17% | 13.2% |
| 4 | C-10+11+12 | 2,810 | 9.45M | 1.01M | 1,054k | 11.33M | 17% | 13.2% |
| 5 | C-13+14+15 | 3,323 | 11.18M | 1.20M | 1,246k | 13.40M | 17% | 13.2% |
| 6 | C-02-1 · as-is | 2,453 | 8.25M | 0.88M | 920k | 9.89M | 17% | 13.2% |
| 7 | E-01 · as-is | 3,491 | 11.74M | 1.26M | 1,309k | 14.07M | 17% | 13.2% |
| 8 | E-02 · as-is | 3,456 | 11.62M | 1.24M | 1,296k | 13.93M | 17% | 13.2% |
| Total | 18 titles | 23,723 | 79.79M | 8.54M | 8.90M | 95.63M | 17% | 13.2% |
| Gross rent @ 375/sq ft (100%) | 8.90M |
| − Structural vacancy 5% + collection 1% | (0.53M) |
| − Management 5% of collected | (0.42M) |
| − Service charge (16.4/sq ft, Mollak) | (0.39M) |
| Stabilised NOI | ~7.56M |
Yield 9.7% on net invested / 11.8% on price. Rent grows 3%/yr; leasing commission 5% (one-time, year 1). VAT on rent is pass-through; VAT on the capital cost is recoverable.
| Purchase price | 64.05M |
| DLD 4% | +2.56M |
| Agency 2.1% | +1.35M |
| Trustee + title (18 × 4,780) | +0.09M |
| Renovation + 12% contingency | +9.57M |
| Net invested · 3,271/sq ft | 77.61M |
| + VAT 5% (recovered ~1Q later) | +3.68M |
| Peak cash deployed | 81.29M |
Hold for rent, sell on income at exit
Whole floor at ~2,700/sq ft, target entry ~2,650. Your advisor walks the 18-title schedule, the fit-out quote and the per-office plan.